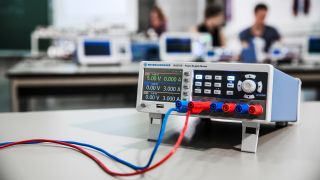
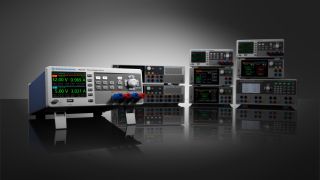
Logged data can be stored on the power supply itself or saved to removeable media like USB drives. In some cases, the data can also be streamed to an external device or computer over a LAN interface using SCPI commands.
Analyzing logged data often involves plotting and performing statistical or trend analysis to gain insights into power consumption patterns and system performance. This can be done with a variety of software tools, such as Microsoft Excel or MATLAB.
How to measure power consumption of a device with the R&S®NGM
Now, it’s time go over the steps of power supply measurement. The precise details would depend on the model of your power supply, but the basic steps should remain more or less the same. Today, we’ll look at how to make and record power measurements using the Rohde & Schwarz R&S®NGM power supply.
Let’s start with standard logging:
- Step 1: Decide on the save location (e.g., USB stick)
- Step 2: Set the logging interval
- Step 3: Set the logging mode
- Step 4: Enable manual triggering (optional)
- Step 5: Configure the format of CSV files that will contain data
We’ll go through each of these steps on the R&S®NGM.
To access the logging menu, press the Menu button and go to the “Device” tab. Logging parameters can be found by scrolling to the “Logging” menu item and pressing the arrow. The logging function must be turned off (or disabled) before the logging configuration can be changed.


