Dynamic noise figure measurements

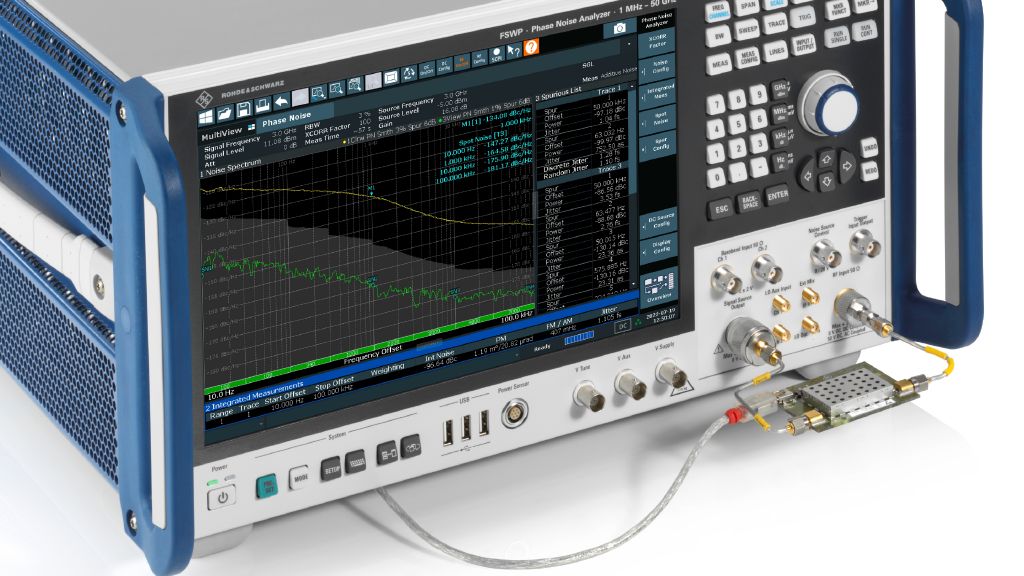
The R&S®FSWP phase noise analyzer and VCO tester is a high-end instrument that accurately analyzes noise in key radar and communications system components. Phase noise measurements are used to derive the large-signal noise figure for a device under real-world operating conditions.

The R&S®FSWP phase noise analyzer and VCO tester can accurately perform noise figure measurements
Abrir Lightbox

Your task

Noise figure measurements are commonly used to characterize the performance of amplifiers, frequency converters and other devices in a signal path. The measured or specified noise figure for a device is a key parameter that system designers use when calculating the uplink and downlink budgets for transmission systems.

The traditional noise figure method uses the common Y-factor method (see Y-Factor Technique for Noise Figure Measurements application note at rohde-schwarz.com/appnote/1MA178 for details). The measurement uses a spectrum analyzer and a noise source to measure the additive noise from a device stimulated with a wideband calibrated noise source. The power levels during such a measurement generate what are called small signal power levels. These noise figures are not directly related to operating conditions. Such device conditions depend heavily on the input power.

Amplifiers in transmitters are not typically used in their small-signal state. The small-signal noise figure is much more important for receivers. Normal amplifier operating conditions in a mobile base station transmitter or radar tend to be in a very specific operating range for maximum linearity and efficiency. This range is often near the 1 dB compression point for a device.

The Y-factor method can produce noise figures that fail to represent the device under realistic operating conditions.

Rohde & Schwarz solution

The phase noise for a device is closely tied to the noise figure. Noise contributors for an amplifier can be broadly seen in the 1/f flicker noise along with wideband noise beyond the flicker knee. Since a noise figure indicates the wideband noise generated by a device, a wideband phase noise measurement can be used to calculate the noise figure. The R&S®FSWP signal source analyzer can help to vary DUT drive levels to better understand the additive/residual phase noise and noise figure performance for a device under varying operating conditions.

The noise figure (NF) can be calculated from a phase noise result using the following equation:

NF = L(f) – Nth + Pin

Where:

L(f): phase noise measured at a specified offset in dBm (1Hz)

Nth: thermal phase noise (–177 dBm (1 Hz))

Pin: calibrated signal level applied to DUT

Example

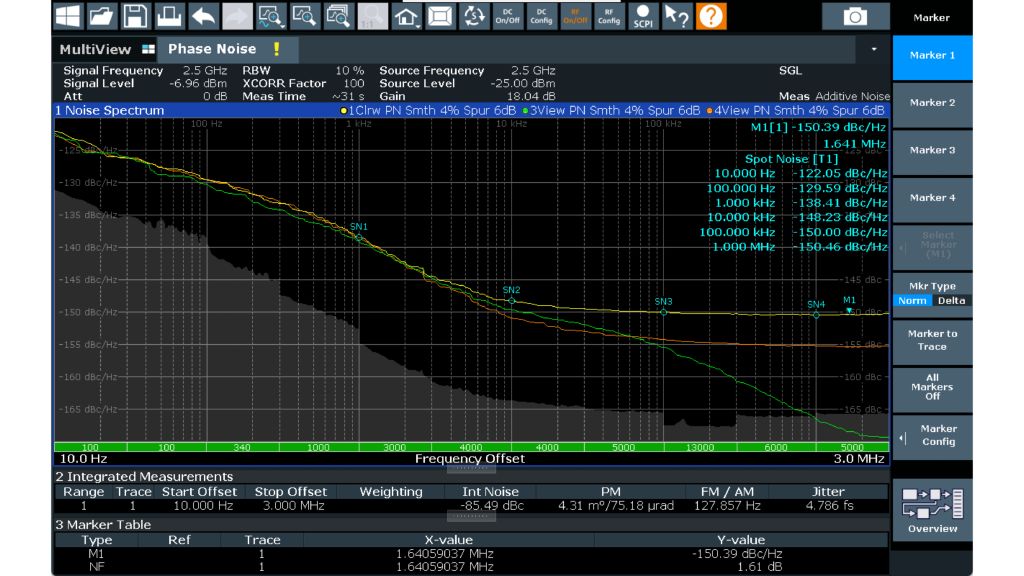
The small-signal noise figure for an amplifier was measured as 1.9 dB at 1900 MHz using the Y-factor method. The phase noise method can be used to calculate the amplifier noise figure for varying input levels.

DUT drive level in dBm Phase noise in dBc (Hz) Noise figure in dB
–25 –150.4 1.6
–20 –155.3 1.7
0 –169.4 No small signal
approach

Summary

Since the DUT is brought close to and beyond the 1 dB compression point (0 dBm drive level), the additive phase noise and the noise figure calculated from the same result are much worse. Under real-world operating conditions, the large-signal noise figure from the phase noise measurements is a more reliable method for calculating the link budget of a transmission system. The R&S®FSWP phase noise analyzer and VCO tester enable accurate and reliable wideband phase noise measurements to calculate the noise figure for a device under varying operating conditions.

Additive phase noise of a device with varying drive level

Related solutions