Key Facts
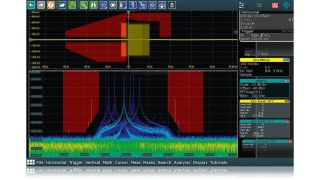
- Multichannel spectrum analysis
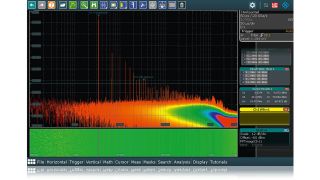
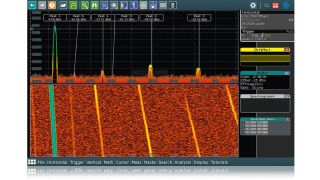
- Display of change in power and frequency over time
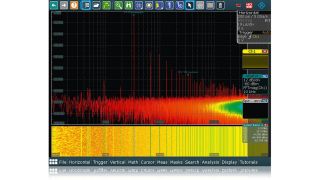
- Frequency analysis with logarithmic display
- Spectrum analysis from DC to instrument bandwidth


Key Facts
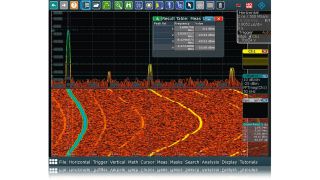
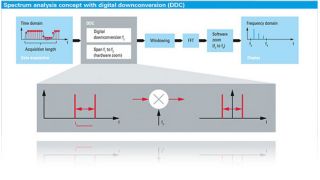
The option enables spectrum analysis capabilities on the R&S®RTH and R&S®RTM3000 oscillsocopes and enhances the multichannel spectrum analysis capabilities of R&S®RTP, R&S®RTO and R&S®RTE oscilloscopes. The option provides features such as spectrogram display and logarithmic frequency axis as well as an automatic peak list detection and additional detector support for R&S®RTP, R&S®RTO and R&S®RTE.
Manufacturer's recommended retail price (MSRP). The price shown does not include VAT. Prices and offers are only intended for entrepreneurs and not for private end consumers.
Términos y condiciones:
La convocatoria es válida del 5 de Abril al 20 de junio de 2021. Participan transmisores de radio FM y TV de cualquier marca que se encuentren aún en operación. Se tomarán válidos para participar los datos registrados solo durante ese periodo de tiempo, solo se puede llenar el formulario 1 vez por persona. El acceso a ingresar datos en el formulario se restringirá el día 21 de Junio a las 00:00hrs. El 30 de Junio de 2021 anunciaremos a un ganador de cada categoría en este mismo web, por correo electrónico y a través de nuestras redes sociales. Más informacion. Anamaria@rohde-schwarz.com
You may use the electronic signature via DocuSign to submit your information to enroll with the Rohde & Schwarz Customer Delegated Administration program. DocuSign processes the information provided according to their . The minimum system requirements for using the DocuSign system may change over time. The current system requirements are found
Términos y condiciones del sorteo de premios con motivo del 10° aniversario de los osciloscopios de Rohde & Schwarz
1. El sorteo «10 años de osciloscopios de Rohde & Schwarz» (en adelante el «sorteo») está organizado por Rohde & Schwarz GmbH & Co. KG, Mühldorfstraße 15, 81671 Múnich, Alemania, tel. +49 89 41 29 0 (en adelante «R&S»).
2. Todos los participantes pueden inscribirse en el sorteo entre el 1 de enero de 2020 y el 31 de diciembre de 2020 indicando su nombre, el nombre de su compañía y el correo electrónico empresarial.
3. La participación es gratuita y no está vinculada a la compra de bienes o servicios.
4. El sorteo está destinado únicamente a personas jurídicas, y solamente éstas tienen facultad para recibir los premios. No está permitida la participación de una persona individual por nombre y cuenta propia, sino que deberá hacerlo como representante de una persona jurídica llenando el formulario de participación en nombre y por cuenta de dicha persona jurídica.
5. Los participantes pueden ganar uno de los 10 R&S®RTB2000 sorteados entre el 1 de enero de 2020 y el 31 de diciembre de 2020:
Premio: 1 osciloscopio digital R&S®RTB2000
6. El sorteo tendrá lugar en la sede de R&S, Muehldorstrasse 15, 81671 Múnich (Alemania). Los ganadores de los premios serán informados por correo electrónico en un plazo de cinco (5) días laborables.
7. El representante autorizado de la persona jurídica deberá notificar a R&S que acepta el premio. En caso de no aceptación o de no obtenerse respuesta en un plazo de dos (2) semanas, se sorteará un nuevo ganador. Si no puede determinarse un ganador en un espacio de cuatro (4) semanas, el sorteo se dará por finalizado y el premio se dará por perdido.
8. Los empleados de R&S, sus familiares, así como cualquier persona que esté implicada en el proceso del sorteo y sus familiares quedan excluidos de llenar el formulario de participación.
9. No está permitido abonar el equivalente en metálico ni intercambiar los premios. Los premios son intransferibles. Todos los impuestos, gravámenes, tasas de aduana, cuotas y otros pagos exigidos en el país del participante correrán por cuenta del participante.
10. Los datos personales se procesarán exclusivamente para los fines de este sorteo de premios y se eliminarán cuatro (4) semanas después de finalizar el mismo, salvo otro acuerdo.
11. R&S se reserva el derecho de descalificar del concurso a cualquier participante que no cumpla los presentes términos y condiciones. En estos casos, los premios también podrán retirarse con efecto retroactivo. En caso de retirarse un premio con efecto retroactivo como consecuencia del incumplimiento de los presentes términos y condiciones, el respectivo participante deberá devolverlo, corriendo con los gastos correspondientes, a la dirección de R&S indicada en el punto 1, y se sorteará un nuevo ganador.
12. Los participantes no tienen derecho a reclamar los premios de este sorteo, ni está previsto ningún recurso legal a este respecto.
13. El sorteo, y cualquier relación contractual que se derive del mismo entre R&S y el respectivo participante, se regirán e interpretarán según la legislación de Alemania, excluyendo todo recurso por conflictos de leyes. Los tribunales de Múnich, Alemania, tendrán la competencia exclusiva en caso de cualquier litigio relacionado directa o indirectamente con la participación en este concurso.
* “fast delivery” inside 7 working days applies to the Rohde & Schwarz in-house procedures from order processing through to available ex-factory to ship.