background

Measurement results in detail

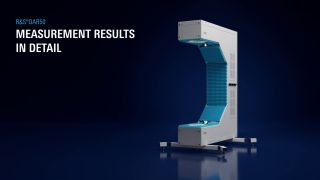
Here we explain the measurement curves and images for different bands and clusters created by the QAR50 and how to interpret them.

Related solutions

リクエスト情報

Do you have questions or need additional information? Simply fill out this form and we will get right back to you.
For service/support requests, please go here to log in or register.

マーケティング・パーミッション

お問い合わせ内容が送信されました。 後ほどご連絡致します。
An error is occurred, please try it again later.